Forest inventory · LiDAR · GIS · Data quality

Reading the forest from above, and checking the data underneath.

I build LiDAR, GIS and image analysis tools in Python, and I spent nearly 20 years making sure data in an Ontario provincial agency met its standard. I'd like to bring both to forest resources inventory: interpreting imagery and point clouds, building spatial layers, and auditing the results against provincial standards.

111 km²of Ontario 2024 classified LiDAR processed end to end
603houses scored from the point cloud across four townships
~20 yrsdata quality, QA and testing at OLG
B.Sc.Mathematics & Computer Science, cum laude
Forest resources inventory

Where my experience meets the work

An FRI built on lidar area-based assessment and feature extraction needs three things from an interpreter: a feel for the forest, fluency with spatial and point cloud data, and the discipline to check every deliverable against the standard. Here is each qualification in the role, what I can show for it today, and where I'm still building.

QualificationEvidenceStatus
LiDAR, elevation models and point cloud data
Built a Python pipeline that reads Ontario classified LAZ tiles, builds a DTM and height-above-ground surface, and measures canopy cover and 1–4 m ladder fuel on a 1 m grid. Ran it on 111 tiles of the 2024 Sault Ste. Marie lift. FireSmart LiDAR →
Demonstrated
GIS and spatial data analysis
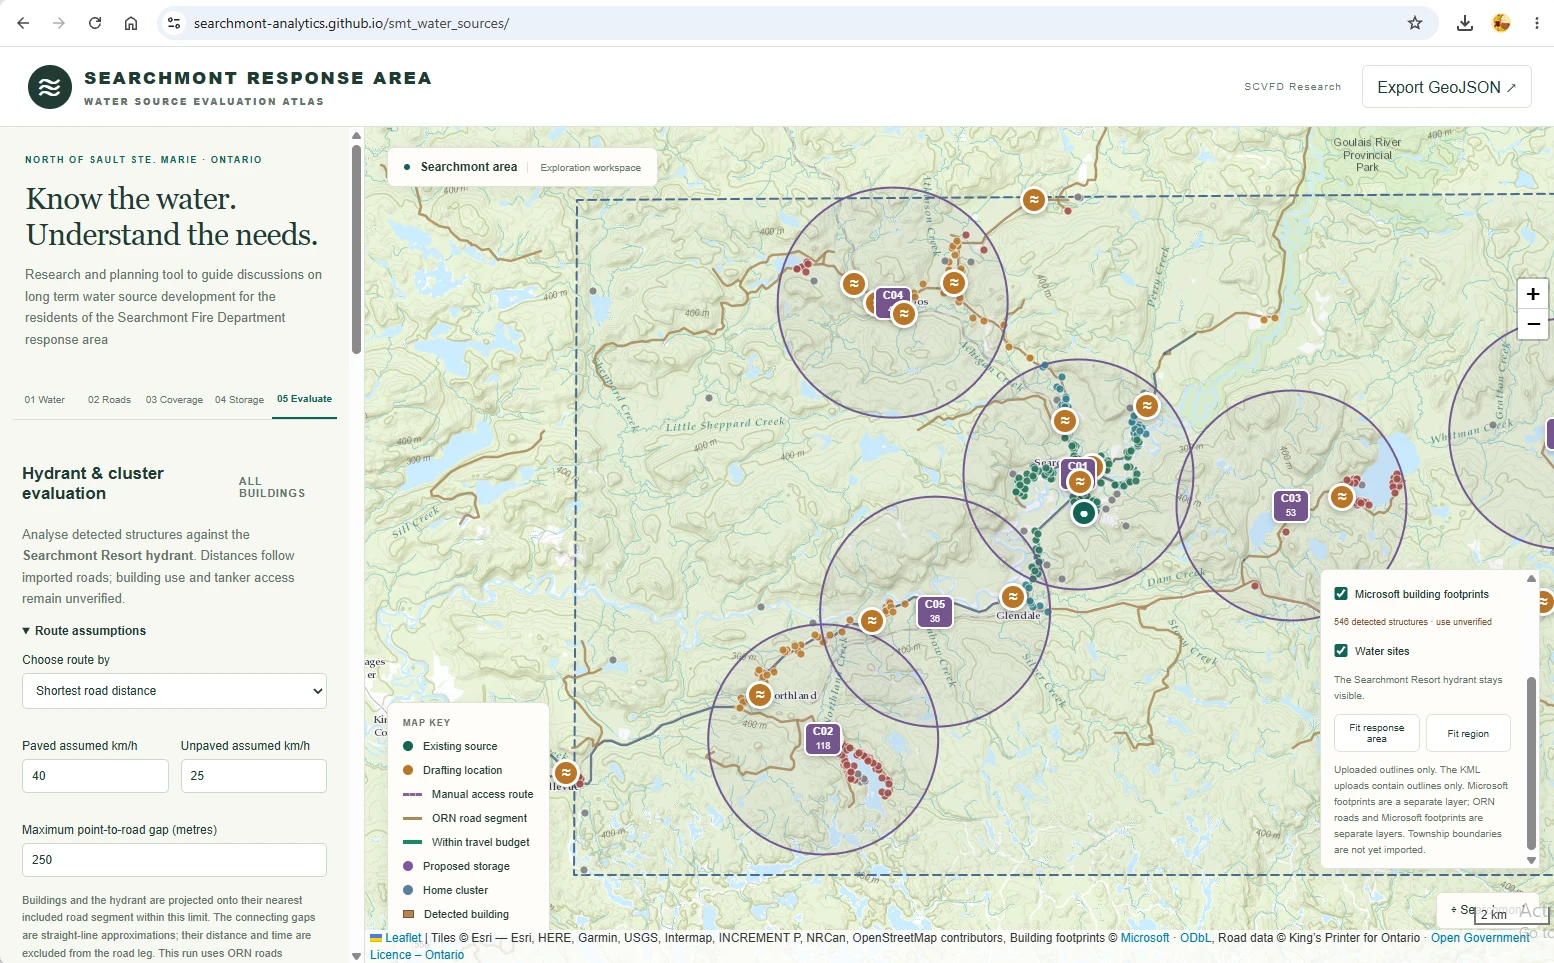
Network routing of 546 building footprints over 162 Ontario Road Network segments, fixed-radius clustering, CRS handling between UTM 16N/17N and WGS84, GeoJSON/CSV exports. Water source atlas →
Demonstrated
Forest inventory standards and quality control QA/QC audits of interpreted inventory
Authored an enterprise data quality strategy and built its config-driven Python QC framework, drift detection and results portal. Every spatial project here is validated against known truth before it is trusted. Studying the Ontario FRI technical specifications next. Data quality work →
Demonstrated Standards: learning
Image interpretation and remote sensing
Completed the Natural Resources Canada Fundamentals of Remote Sensing tutorial. Built a computer vision prototype that detects, tracks and classifies objects from video frames and scores itself against ground truth. Lift Vision Lab →
Building
Forest ecology and tree identification
Built an AI-assisted flashcard system for Ontario tree species and forest ecology, including the look-alikes the role calls out: poplar and birch, spruce and balsam fir. Thirty years living and working in the Algoma forest. Learning →
Building
Soils, landforms and environmental science
The next deck in the same learning system, covering soils, drainage, landforms and ecosites. Learning →
Learning
AI and machine learning; cloud storage and computing
Object detection and tracking with precision/recall evaluation; z-score drift detection on a 30-day rolling baseline; Python on Cloudera AI; migration to SaaS IBM watsonx; static apps published on GitHub Pages and Cloudflare. AI tools are part of how I build and how I learn.
Demonstrated
Troubleshooting software and technical issues
QA analyst, environment provisioning analyst and DQ analyst: defect management, SIT/UAT environments, and pipelines that switch from SQLite to Impala and SQL Server through one config file.
Demonstrated
Project management, reporting and teamwork
Led a 21-person volunteer fire department for 11 years; secretary of a 26-department mutual aid association; delivered strategy and migrations through business and IT teams. Results reported through maps, dashboards and trend charts.
Demonstrated
Demonstrated shown in the work below Building foundations in place, growing Learning in active study

On stereo interpretation: I haven't yet interpreted forest stands in stereo imagery to FRI standards. That's the skill I most want to develop in this role. What I bring to it is strong spatial reasoning, LiDAR experience that complements the imagery, a fast and structured way of learning, and a long habit of checking my own work against a known answer.

Selected project work

Projects

Three personal spatial and image analysis projects from the Searchmont area north of Sault Ste. Marie, all public with their source code, followed by recent work from my role as Senior Data Quality Analyst at OLG. The OLG code and data belong to OLG, so those are summaries of the design and results.

LiDAR, GIS and image analysis

Personal projects · public source

Computer vision · Image analysis · Personal project

Lift Vision Lab

A browser-only computer vision prototype that detects, tracks and classifies riders on a chairlift from video frames, then scores itself against ground truth.

  • JavaScript
  • Canvas pixel analysis
  • Object tracking
  • Precision / recall
  • Human review loop
Problem
Counting and classifying what a camera sees, reliably enough to report on, without hiding where the method fails.
Approach
Reads rendered frame pixels, extracts connected dark silhouettes inside an analysis band, links detections over time into tracks and counts each one once as it clears a gate. Silhouette geometry gives an equipment class, a colour cue flags patrol. A reviewer can correct a label or reject a false count; raw metrics still reflect the original detections.
Evaluation
Events are matched one-to-one against ground truth within 0.5 s and 18 px. Baseline: 12 of 12, 100% precision and recall. Stress scenario with snow, occlusion and low contrast: 100% precision, 83.3% recall, with each miss explained. The README sets out a pilot plan with independent second-reviewer labelling, held-out footage and acceptance gates.
Why it matters here
The same disciplines apply to feature extraction from imagery: define the class, measure it against reviewed truth, report precision and recall by condition, and keep a human in the loop for the uncertain cases.
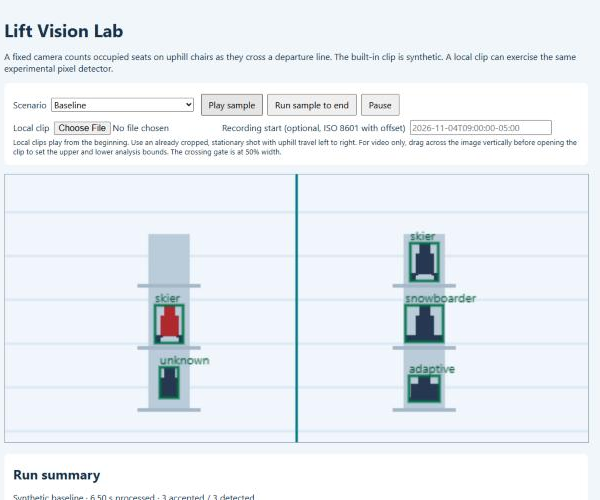
Lift Vision Lab running the baseline sample: chairs move left to right past a vertical gate line, with detected riders boxed and labelled skier, snowboarder, adaptive and unknown
Baseline sample mid-run: tracked riders, class labels and the counting gate.

Data quality and quality control

Senior Data Quality Analyst · OLG

Python · Cloudera AI

Config-driven data quality framework

Checks across thousands of critical data elements, defined in configuration rather than hand-written code.

  • Python
  • YAML config
  • Impala
  • MS SQL Server
  • SQLite
  • CLI
Problem
OLG's primary data quality tool was unavailable during its migration to IBM watsonx, but thousands of critical data elements (CDEs) still needed checking.
Approach
Championed, designed and built a Python framework on Cloudera AI. A single YAML file is the source of truth for every CDE: its table and column, risk tier, owner, validity pattern and thresholds. Completeness thresholds default by tier (95%, 90% and 80%) and can be overridden per element. A command-line scheduler runs daily checks by mode, tier or element and returns a failing exit code so alerting pipelines can react.
Testing
It runs locally on SQLite and switches to Impala sources and an MS SQL Server results database by editing one environment file, with no code changes. Seed scripts create synthetic data with known, planted problems and the expected result for each check, so the framework is proven against a known answer before it touches production.
Result
Data quality coverage continued through the tool migration. Adding a CDE means adding a config entry, not writing a new script.
Infographic of the config-driven data quality framework: the problem, a YAML config driving a Python framework on Cloudera AI, tier-based completeness thresholds, a CLI that returns a failing exit code for alerting, testing on SQLite with seed scripts before moving to Impala and MS SQL Server, and the result of continued coverage
Overview of the framework: problem, approach, testing and result.
Statistics · Monitoring

Data observability and drift detection

A baseline layer that watches every column every day and flags what has changed.

  • Python
  • Time series
  • z-score detection
  • Data profiling
Problem
Hand-written rules only catch the problems someone thought of in advance.
Approach
Built daily column-level metrics (row counts, null rates, distinct counts, min and max) and used z-scores against a 30-day rolling baseline to flag drift from each column's own norm, at high, medium and low severity. A 7-day burn-in keeps new elements from raising alerts before a baseline exists. In testing it catches a null-rate spike, a row-count drop and a collapse in distinct values.
Result
Broad, low-effort monitoring across the data lake, so expert effort could go to the highest-risk data.
Five-step observability process: compute daily column metrics, compare to a 30-day rolling baseline with z-scores, apply guardrails including a 7-day burn-in, flag drift at high, medium and low severity, and focus expert effort on the highest-risk data. Outcome: broad, low-effort monitoring across the data lake.
Architecture · Strategy

Enterprise DQ strategy and risk-tiered coverage

A 14-section strategy and a three-layer control model that puts effort where the risk is.

  • DAMA-DMBOK
  • COBIT
  • Risk tiering
  • Governance
Problem
Writing one rule for every element across thousands of CDEs does not scale, and spreads effort evenly regardless of risk.
Approach
Authored the enterprise data quality strategy (dimensions, controls, monitoring, issue management, tooling, regulatory alignment, change management and a maturity roadmap) and designed a three-layer control model:
Curated, governed rulesDeep, business-owned checks for Tier 1 critical data
Automated completeness rulesBaseline checks for every element in scope
Observability monitoringDaily metrics and drift detection across everything
Result
Business-led Tier 1 to 3 classification directs governed rules to the highest-risk elements and automation to the rest. An Authoritative Data Source principle means curated rules run once at the point of origin and downstream zones inherit the results.
Dashboards · SQL Server

Data Quality Portal and central results database

One view of data health, whichever tool ran the check.

  • Streamlit
  • Plotly
  • Pandas
  • Impala
  • MS SQL Server
Problem
Results were scattered across Python checks, Alteryx and watsonx, each in its own format, and data owners had no single place to see them.
Approach
Architected a central results database on MS SQL Server with a common schema tagged by source system. Built a multi-page Streamlit portal on top of it: dataset explorer, column profiling, rule results, drill-down to failed records, DQ trends, metadata, observability metrics and a cross-table alert feed.
Why Streamlit
The portal is written entirely in Python, the same language as the DQ framework, so the data quality team could build and maintain it without a separate web development project. Pandas tables and Plotly charts drop straight onto a page, and built-in filters and selectors make drill-downs simple to add. New pages took hours rather than weeks, so the portal could grow alongside the program.
Result
Data owners and stewards see what is checked, what passed and what is drifting in one place. Admins can switch pages on and off without a redeploy, and a focused observability-only build runs from the same code.
Illustration of the Data Quality Portal: results from Python checks, Alteryx and watsonx flow into a central MS SQL Server results database, which feeds a dashboard with summary tiles, a DQ trend chart, results by source system, recent rule failures and data health by dataset
Illustration of the portal and how results flow into it. Figures shown are sample values.
Training · Web

DQ learning portal (mini-LMS)

A complete curriculum, written and built by me, to train data stewards and data owners.

  • Python / Flask
  • HTML / CSS / JavaScript
  • Docker
  • Instructional design
Problem
A data quality program only works if the people who own the data understand their role in it.
Approach
Designed the portal and all of its content: 3 modules and 17 lessons covering DQ principles, how data quality affects their work, their role in the process, the tooling, and how the enterprise strategy fits together. Lessons combine written guides, scenario-based quizzes and progress tracking, plus practice games such as Dirty Record Detective, Dimension Sorter, The Cascade Effect and Steward for a Day.
Result
A self-paced Flask web app, packaged in Docker. Learner progress, quiz results and feedback feed engagement, mastery and reach dashboards in the Data Quality Portal, so the program can see who is learning and where lessons need work.
DQ learning portal (mini-LMS) A complete curriculum, written and built by Travis McCormack, to train data stewards and data owners: 3 modules and 17 lessons with written guides, scenario-based quizzes, progress tracking and practice games (Dirty Record Detective, Dimension Sorter, The Cascade Effect, Steward for a Day). A self-paced Flask web app packaged in Docker; learner progress, quiz results and feedback feed engagement, mastery and reach dashboards in the Data Quality Portal. Python · Flask · Docker: DQ learning portal (mini-LMS) A complete curriculum, written and built by me, to train data stewards and data owners. Problem Data quality program data stewards and owners A data quality program only works if the people who own the data understand their role in it. ? ? ? Approach Curriculum and portal, end to end Designed, written and built learning-hub Learning Hub 3 modules · 17 lessons + practice games · quizzes · progress 1 DQ Fundamentals + Program Model 8 lessons 2 WatsonX — Tier 1 Curated Rules 6 lessons 3 Python Framework — Tier 2 + 3 3 lessons Covers DQ principles, how DQ affects their work, their role in the process, the tooling, and how the enterprise strategy fits together. Inside every lesson Written guides read at your own pace Scenario-based quizzes apply it to real situations Progress tracking lesson complete 100% Practice games Dirty Record Detective Hunt the defect in each record Dimension Sorter Sort records into the right dimension The Cascade Effect Spot how one bad record compounds Steward for a Day Work a shift of live DQ alerts Self-paced web app Docker container Flask app Python · HTML / CSS / JS learners, at their own pace Result Learner progress, quiz results and feedback feed engagement, mastery and reach dashboards in the Data Quality Portal, so the program can see who is learning and where lessons need work. Data Quality Portal Engagement Mastery quiz results Reach Python / Flask · HTML / CSS / JavaScript · Docker · Instructional design
How the Learning Hub works, from the problem it solves to the dashboards it feeds.
Migration · Testing

Governance platform migration to IBM watsonx

Moving rules and catalogue content from on-premises IBM InfoSphere to SaaS.

  • IBM watsonx.data intelligence
  • InfoSphere IGC
  • Synthetic test data
Problem
Moving years of glossary content and DQ rules to a new platform without losing trust in the results.
Approach
Led the migration of IGC content and DQ rules, and designed a parallel test environment with synthetic source data and seeded history.
Result
Rules and alerts are validated before they reach production.
AI-assisted learning

Closing the gaps, on purpose

The role asks for knowledge I'm still building, so I build learning tools for it. I use AI to turn authoritative sources into structured study material, check it against those sources, and drill it until it sticks. It's the same approach behind the DQ Learning Hub, pointed at forestry.

Completed

Fundamentals of Remote Sensing

Natural Resources Canada's Canada Centre for Remote Sensing tutorial.

  • Electromagnetic radiation and spectral signatures
  • Sensors, platforms and resolution
  • Radar and microwave sensing
  • Image interpretation and analysis
  • Applications, including forestry
Built

Forest ecology and tree identification

A flashcard learning system for Ontario's trees and forests.

  • Species identification and look-alikes: poplar and birch, spruce and balsam fir
  • Forest ecology and stand dynamics
Public repo and live version coming soon
SourceStart from authoritative material: government tutorials, field guides, standards.
StructureUse AI to draft cards and questions organised by topic and difficulty.
VerifyCheck every card against the source before it goes into the deck.
DrillRepeat until it sticks, and track what still needs work.
Background

Experience

2013 – 2026

Senior Data Quality Analyst · OLG

Helped build Data Governance from the ground up, supported the move to IBM InfoSphere and a new Cloudera data lake, then authored the enterprise DQ strategy and built its Python technical core.

2011 – 2013

Environment Provisioning Analyst · OLG

Led a multi-environment model for the Customer Hub (Siebel) master data project, and enabled SIT and UAT for OLG's electronic bingo line of business.

2007 – 2011

Quality Assurance Analyst and Voice Network Analyst · OLG

Led an upgrade of defect management software for all testing teams, letting OLG retire a second vendor's tool.

1995 – 2023

Fire Chief (2012 – 2023) and Firefighter · Searchmont Community VFD

Led a 21-person volunteer department with incident command at fire, rescue, hazmat and medical calls. Coordinated with the Ministry of Natural Resources, the Office of the Fire Marshal, the OPP, paramedic services and mutual aid partners. Secretary of the Algoma Mutual Aid Association (26 departments).

2006 – 2009

B.Sc. Mathematics and Computer Science · Algoma University

Graduated cum laude, with the Graduating Class Award of Excellence in Mathematics.

LiDAR and remote sensing

  • LAS 1.4 / LAZ point clouds (laspy)
  • DTM, height above ground, canopy height
  • Canopy cover and vertical structure metrics
  • Ontario classified point cloud, GeoHub tile indexes

GIS and mapping

  • Leaflet web maps, GeoJSON, Esri basemaps
  • Shapely, pyproj, UTM / NAD83(CSRS)
  • Network routing, proximity and clustering
  • Ontario Road Network, building footprints

Image analysis and ML

  • Detection, tracking and classification
  • Precision, recall, ground-truth matching
  • z-score anomaly and drift detection

Programming and data

  • Python: NumPy, SciPy, Pandas, frameworks, pipelines
  • SQL: MS SQL Server, Sybase, DB2, Hive, Impala
  • Streamlit, Flask, Plotly, JavaScript
  • Cloudera, IBM watsonx, Power BI, Alteryx

Fire service and training

  • IMS 100, NFPA 1021 Fire Officer I
  • NFPA 1041 Instructor, NFPA 1072 Hazmat
  • Ontario Fire College legislation courses
Live LiDAR demo

Explore the FireSmart LiDAR map

Canopy height, canopy cover and ladder fuel measured from an airborne point cloud, scored house by house against the FireSmart Home Ignition Zone.

Try it: switch between Zone 1 and Zone 2, turn on Ladder fuel, then select a house to see its rings and recommendations.

Open the demo map ↗

Let's talk

I'm interested in forest resources inventory, remote sensing and GIS roles with the Ministry of Natural Resources in Sault Ste. Marie. References are available from the Ministry of Natural Resources (Fire Science and Planning), paramedic services, the OPP and OLG.